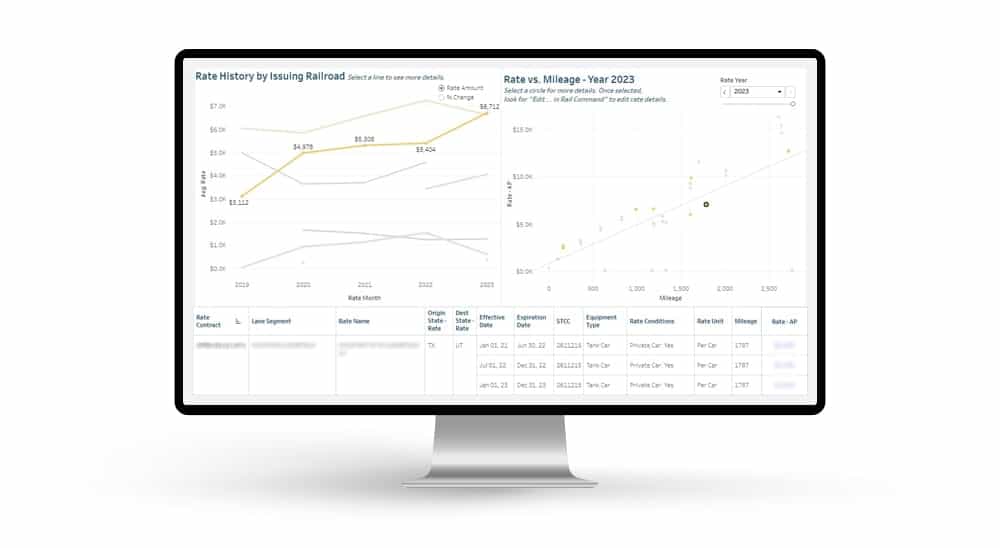
The chart below shows the weekly volume of carloads carried by the major railroads in North America. Carloads carried is the sum of carloads originated and carloads received from connecting railroads. This information can show not only the volume that a rail carrier transports, but also indicates the general market share of each carrier. This can show which rail carriers are gaining or losing share at different times and how the carriers are competing, which can help to inform your rail rate negotiations.
Chart Viewing Tips: You can use the Weekly Cars by Railroad report in multiple ways. By filtering the data accordingly, you can pinpoint the information that you need at any given time. You might filter the data by Railroad to see the weekly carload volume of a particular rail carrier, or choose multiple railroads to compare them.
You can make your selections or use these shortcuts to filter the information that you need:
- Click on a name in the chart legend to highlight that data range. Use Ctrl+Click to select multiple ranges.
- On a chart, mouse-over any data point in order to view additional detail.
- Click on a data range to select that range and view additional options (Keep Only, Exclude, View and download underlying data).
- Click to select any data point.
- Click and drag to select multiple points.
- Ctrl + shift + click to zoom in.
- Shift + click and hold to pan the chart.
Why Is This Railroad Tracking Data Important?
How can this information help you? There are many instances where it may be useful for shippers to analyze and compare carload volume and market share data by railroad. For instance, this data, as well as other data points, can be an indication of how aggressive a carrier may be in their pricing relative to their competition. This can help inform your rail rate negotiations. Carriers that are quickly increasing their weekly volume may be more likely to negotiate and buy your business from competitors.
Need More Information?
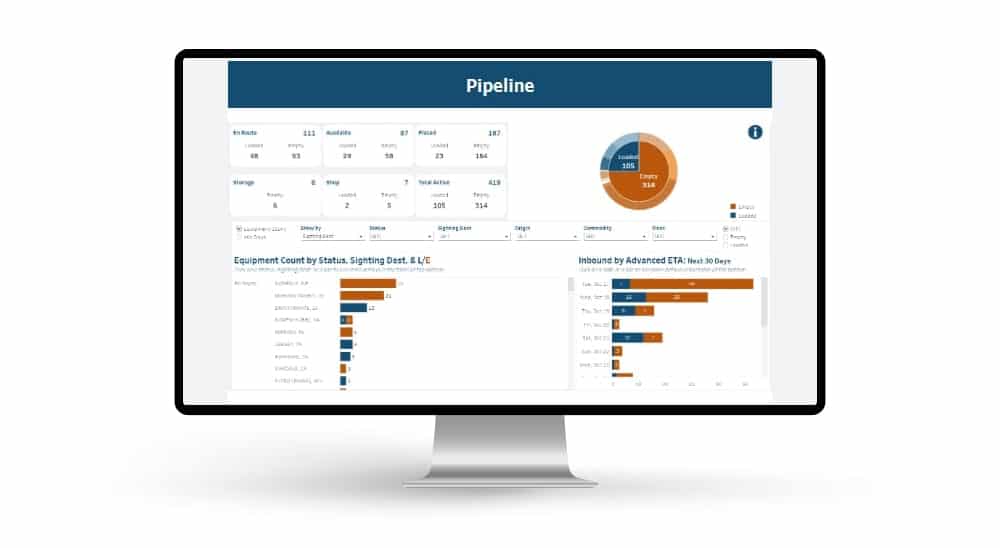
These performance charts are an example of the type of reporting data that is included in our railcar management software. These charts can be filtered in many different ways and you can download this data in a format that works best for you.
RSI maintains a series of railroad statistics and information that can help you be more informed in your rail route planning, rail rate negotiations and more. Based on your business, RSI can monitor specific events and trends and provide you with up-to-date railcar tracking information. If you are interested in learning more about RSI’s proactive monitoring and railcar tracking services, please contact us.