The Total Cars Held Report shows the average number of cars in revenue service that have not moved in 48 hours or more. This information is based on daily snapshots taken throughout the week, according to information provided by Class 1 railroads to the Surface Transportation Board (STB) on a weekly basis. This information is useful in determining which railroads are affected by service issues, when you might expect longer holding times, and how you might anticipate or plan for these events.
This data set includes loaded and empty moves for all car types. It does not include cars placed at a customer facility, in constructive placement, placed for interchange to another carrier, in bad order status, in storage, or operating in railroad service. In addition, only U.S. operations are included for Canadian railways. Please note that the railroads changed their reporting method on March 29, 2017. Prior to that date, they reported the weekly number of cars instead of the daily average.
Chart Viewing Tips: The Total Cars Held Report provides detailed information on Class 1 railroads’ performance across an extended time frame. Using the filters provided, you can compare the number of cars held by different railroads, and compare overall cars held at different times. When you filter the data by Railroad, you can easily select any railroads that you work with or those you might work with in the future. You can also use the Date Range filter to narrow your results according to a specific month, quarter, or year.
Use these shortcuts to filter and view the information you need quickly and easily:
- Click on a name in the chart legend to highlight that data range. Use Ctrl+Click to select multiple ranges.
- On a chart, mouse-over any data point in order to view additional detail.
- Click on a data range to select that range and view additional options (Keep Only, Exclude, View and download underlying data).
- Click to select any data point.
- Click and drag to select multiple points.
- Ctrl + shift + click to zoom in.
- Shift + click and hold to pan the chart.
Why Is This Important?
How can you use the Total Cars Held Report? Monitoring railroad tracking data for the frequency of cars held by each carrier allows you to quickly identify carriers experiencing service issues, and those that are making improvements. You can also view data between carriers and make comparisons. This information can help you make the most informed decisions when selecting a transit facility or rail route. In addition, you can forecast cars held according to a date range or carrier you are working with. Some months or quarters may see a spike in cars held for certain railroads, while others may see gradual increases, decreases, or relatively steady advancement.
Need More Information?
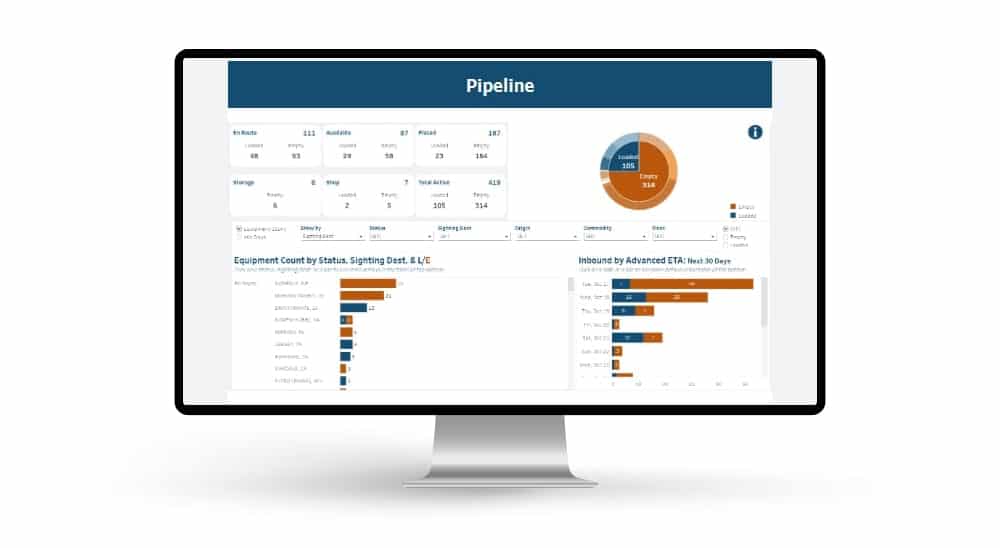
These performance charts are an example of the type of reporting that is included in our railcar management software. Notice that these charts can be filtered on the fly and downloaded in various formats. RSI maintains a series of railroad statistics and information that can help you be more informed. Based on your business, RSI can monitor specific events and trends and provide you with up-to-date railcar tracking information. If interested in learning more about RSI’s proactive monitoring and railcar tracking services, please contact us.


 Automated exception reporting of the railcar tracking data makes it easy to identify and troubleshoot jeopardized shipments, thereby enabling you to provide better service to your stakeholders.
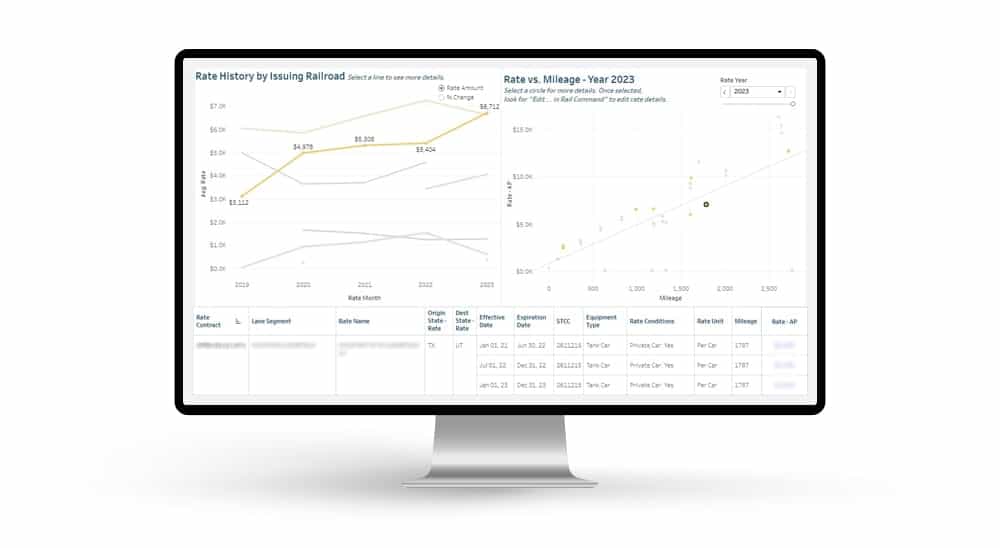
 Receive notification of pending rate expirations. Tariff changes and fuel surcharges can be automatically updated.