The graph below shows either the total, originated, or received carload rail traffic by commodity and railroad. Carload traffic is classified into 20 major commodity categories, such as coal, chemicals, grain, and primary metal products. You can use this information to monitor rail traffic in your specific industry. This information can help you make more informed rail rate negotiations. Use the filters on the right to exclude or include specific commodities and use the Week Ending filter to analyze specific time periods.
Chart Viewing Tips: There are many ways to filter and weekly cars by industry data. You can select multiple commodity groups to analyze any commodities that you work with. You can also change the Week Ending filter to review previous years, quarters, months, weeks or days. This will show the overall rail traffic for your commodities over time, and reveal important trends.
Change the filters or use these shortcuts to change the data set:
- Click on a name in the chart legend to highlight that data range. Use Ctrl+Click to select multiple ranges.
- On a chart, mouse-over any data point in order to view additional detail.
- Click on a data range to select that range and view additional options (Keep Only, Exclude, View and download underlying data).
- Click to select any data point.
- Click and drag to select multiple points.
- Ctrl + shift + click to zoom in.
- Shift + click and hold to pan the chart.
Why Is This Important?
Railroad tracking data of carload volume by commodity can help you monitor the shipping environment for your products. Is volume increasing or decreasing? When carload volumes drop, the rail carriers tend to price more aggressively to hopefully stimulate more activity. Conversely, as volumes increase, the rail carriers often elevate pricing as a result of the increase in demand. This data can help you refine your rail rate negotiation strategies, and find which rail carriers might be most willing to negotiate with you based on the type of commodities that you work with. You can also use the information to make forecasts for your commodities based on the historic traffic for particular months, seasons, or quarters. Finally, if you are analyzing a recent price spike or a gradual price increase that you’ve experienced across your rail route, you can use the Weekly Carloads report to see if this price increase makes sense for your commodity, or if it’s time to renegotiate.
Need More Information?
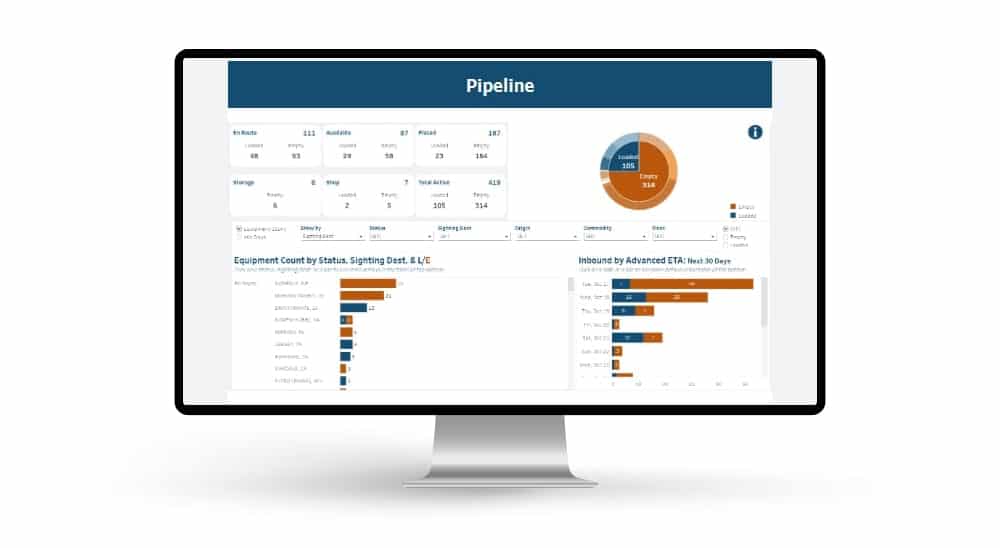
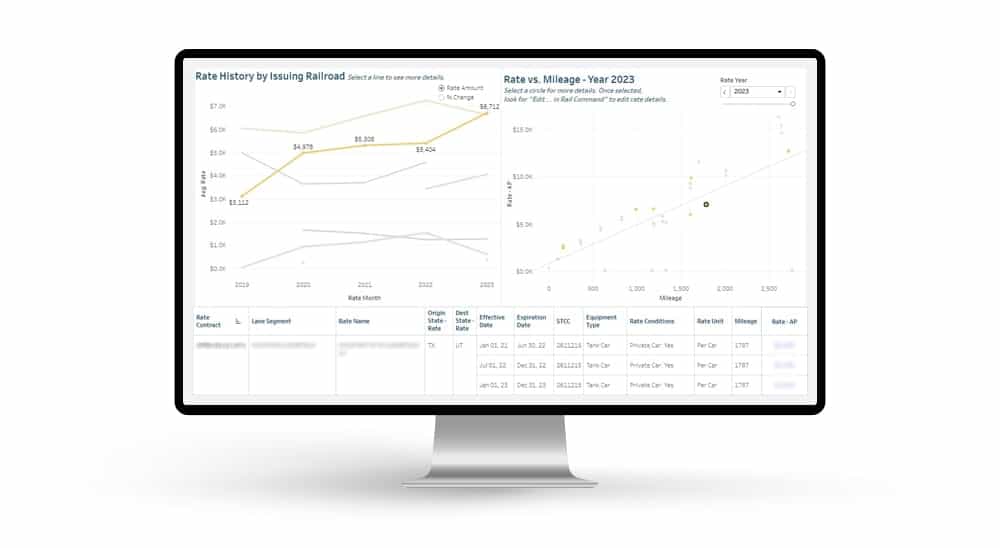
These performance charts are an example of the type of reporting that is included in our railcar management software. Notice that these charts can be filtered on the fly and downloaded in various formats. RSI maintains a series of railroad statistics and information that can help you be more informed. Based on your business, RSI can monitor specific events and trends and provide you with up-to-date railcar tracking information. If interested in learning more about RSI’s proactive monitoring and railcar tracking services, please contact us.


 Automated exception reporting of the railcar tracking data makes it easy to identify and troubleshoot jeopardized shipments, thereby enabling you to provide better service to your stakeholders.
 Receive notification of pending rate expirations. Tariff changes and fuel surcharges can be automatically updated.