The Rail Cost Adjustment Factor (RCAF) is an index formulated to represent changes in railroad costs incurred by the nation’s largest railroads and is a useful data point for understanding if rate increases by the rail carriers are reasonable. The RCAF measures the rate of inflation in railroad inputs and is comprised of seven component indexes: labor, fuel, materials and supplies, equipment rents, interest, depreciation, and other expenses. It was created for regulatory purposes and is reviewed and governed by the Surface Transportation Board (STB).
There are five indexes associated with the RCAF:
- The Forecasted All-Inclusive Index – The forecasted price index that underlies the RCAF.
- The actual All-Inclusive Index – This index is calculated when the data becomes available.
- The RCAF (unadjusted) – This index reflects cost changes experienced by the railroad industry, without reference to changes in rail productivity and is derived by adjusting the Forecasted All-Inclusive Index by the “forecast error” from the second prior quarter.
- The RCAF (adjusted) – This index reflects national average productivity changes as originally developed and applied by the ICC, the calculation of which is currently based on a five-year moving average. It is derived by modifying the RCAF (unadjusted) for moving five-year productivity gains as soon as the latest quarter of productivity is available.
- The RCAF-5 – Reflects the five-year moving average productivity adjustment factor which is incorporated into the index during the first quarter of the year. This index also reflects national average productivity changes; however, those productivity changes are calculated as if a five-year moving average had been applied consistently from the productivity adjustment’s inception in 1989.
Rail Cost Adjustment Factor
| Productivity-Adjusted RCAF | RCAF | ||||||||||
| Year | Quarter | Preliminary RCAF | Forecast Error Adjustment | RCAF (Unadjusted) |
RCAF (Unadjusted Change) |
Productivity Adjustment Factor | RCAF (Adjusted) | RCAF (Adjusted Change) |
PAF-5 | RCAF-5 | RCAF-5 Change |
| 2014 | Q1 | 1.108 | -0.004 | 1.104 | 0.64% | 2.3110 | 0.478 | 0.42% | 2.4480 | 0.451 | 0.45% |
| Q2 | 1.122 | -0.025 | 1.097 | -0.63% | 2.3168 | 0.473 | -1.05% | 2.4534 | 0.447 | -0.89% | |
| Q3 | 1.119 | -0.011 | 1.108 | 1.00% | 2.3226 | 0.477 | 0.85% | 2.4588 | 0.451 | 0.89% | |
| Q4 | 1.109 | -0.009 | 1.100 | -0.72% | 2.3284 | 0.472 | -1.05% | 2.4642 | 0.446 | -1.11% | |
| 2015 | Q1 | 1.074 | -0.010 | 1.064 | -3.27% | 2.3342 | 0.456 | -3.39% | 2.4704 | 0.431 | -3.36% |
| Q2 | 1.025 | -0.036 | 0.989 | -7.05% | 2.3382 | 0.423 | -7.24% | 2.4766 | 0.399 | -7.42% | |
| Q3 | 1.020 | -0.086 | 0.934 | -5.56% | 2.3422 | 0.399 | -5.67% | 2.4828 | 0.376 | -5.76% | |
| Q4 | 0.996 | -0.025 | 0.971 | 3.96% | 2.3462 | 0.414 | 3.76% | 2.4890 | 0.390 | 3.72% | |
| 2016 | Q1 | 0.992 | -0.020 | 0.972 | 0.10% | 2.3502 | 0.414 | 0.00% | 2.4932 | 0.390 | 0.00% |
| Q2 | 0.959 | -0.014 | 0.945 | -2.78% | 2.3584 | 0.401 | -3.14% | 2.4974 | 0.378 | -3.08% | |
| Q3 | 0.994 | -0.046 | 0.948 | 0.32% | 2.3667 | 0.401 | 0.00% | 2.5016 | 0.379 | 0.26% | |
| Q4 | 0.985 | 0.005 | 0.990 | 4.43% | 2.3750 | 0.417 | 3.99% | 2.5059 | 0.395 | 4.22% | |
| 2017 | Q1 | 1.011 | -0.012 | 0.999 | 0.91% | 2.3833 | 0.419 | 0.48% | 2.5147 | 0.397 | 0.51% |
| Q2 | 1.021 | -0.004 | 1.017 | 1.80% | 2.3797 | 0.427 | 1.91% | 2.5235 | 0.403 | 1.51% | |
| Q3 | 1.016 | 0.000 | 1.016 | -0.10% | 2.3761 | 0.428 | 0.23% | 2.5323 | 0.401 | -0.50% | |
| Q4 | 1.010 | -0.010 | 1.000 | -1.57% | 2.3725 | 0.421 | -1.64% | 2.5412 | 0.394 | -1.75% | |
| 2018 | Q1 | 1.038 | -0.011 | 1.027 | 2.70% | 2.3689 | 0.434 | 3.09% | 2.5374 | 0.405 | 2.79% |
| Q2 | 1.039 | 0.002 | 1.041 | 1.36% | 2.3665 | 0.440 | 1.38% | 2.5336 | 0.411 | 1.48% | |
| Q3 | 1.072 | -0.011 | 1.061 | 1.92% | 2.3641 | 0.449 | 2.05% | 2.5298 | 0.419 | 1.95% | |
| Q4 | 1.081 | -0.002 | 1.079 | 1.70% | 2.3617 | 0.457 | 1.78% | 2.5260 | 0.427 | 1.91% | |
| 2019 | Q1 | 1.071 | -0.013 | 1.058 | -1.95% | 2.3593 | 0.448 | 1.97% | 2.5235 | 0.419 | 1.87% |
| Q2 | 1.067 | -0.002 | 1.065 | 0.66% | 2.3621 | 0.451 | 0.67% | 2.5210 | 0.422 | 0.72% | |
| Q3 | 1.082 | -0.025 | 1.057 | -0.75% | 2.3649 | 0.447 | -0.89% | 2.51858 | 0.420 | -0.47% | |
| Q4 | 1.077 | -0.002 | 1.075 | 1.70% | 2.3677 | 0.454 | 1.57% | 2.5160 | 0.427 | 1.67% | |
| 2020 | Q1 | 1.065 | -0.022 | 1.043 | -2.98% | 2.3705 | 0.440 | -3.08% | 2.5190 | 0.414 | 0.12% |
| Q2 | 1.057 | -0.006 | 1.051 | 0.77% | 2.3764 | 0.442 | 0.45% | 2.522 | 0.417 | -0.72% | |
| Q3 | 0.997 | -0.008 | 0.989 | -5.90% | 2.3823 | 0.415 | -6.11% | 2.3823 | 0.392 | -6.00% | |
| Q4 | 1.011 | -0.070 | 0.941 | -4.85% | 2.3883 | 0.394 | -5.06% | 2.5280 | 0.372 | -5.10% | |
| 2021 | Q1 | 1.027 | 0.013 | 1.04 | 10.52% | 2.3943 | 0.434 | 10.15% | 2.5343 | 0.410 | 10.22% |
| Q2 | 1.067 | -0.008 | 1.059 | 1.83% | 2.3991 | 0.441 | 1.61% | 2.5406 | 0.417 | 1.71% | |
| Q3 | 1.113 | 0.021 | 1.134 | 7.08% | 2.4039 | 0.472 | 7.03% | 2.547 | 0.445 | 6.71% | |
| Q4 | 1.127 | 0.012 | 1.139 | 0.44% | 2.4087 | 0.473 | 0.21% | 2.5534 | 0.446 | 0.22% | |
| 2022 | Q1 | 1.16 | -0.006 | 1.154 | 1.32% | 2.4135 | 0.478 | 1.06% | 2.5585 | 0.451 | 1.12% |
| Q2 | 1.186 | 0.011 | 1.197 | 3.73% | 2.4285 | 0.493 | 3.14% | 2.5636 | 0.467 | 3.55% | |
| Q3 | 1.243 | 0.007 | 1.250 | 4.43% | 2.4436 | 0.512 | 3.85% | 2.5687 | 0.487 | 4.28% | |
| Q4 | 1.253 | 0.042 | 1.295 | 3.60% | 2.4588 | 0.527 | 2.93% | 2.5738 | 0.503 | 3.29% | |
| 2023 | Q1 | 1.013 | -0.003 | 1.01 | -22.01% | 2.474 | 0.408 | -22.58% | 2.5898 | 0.39 | -22.47% |
| Q2 | 1.008 | -0.004 | 1.004 | -0.59% | 2.4911 | 0.403 | -1.23% | 2.6059 | 0.385 | -1.28% | |
| Q3 | 1.002 | -0.027 | 0.975 | -2.89% | 2.5083 | 0.389 | -3.47% | 3.6221 | 0.372 | -3.38% | |
| Q4 | |||||||||||
(2017 Q4 Base)
All Inclusive Index Less Fuel
The AII-LF Index was created to provide a parallel measure of the Rail Cost Adjustment Factor without the influence of the fuel cost component. All of the components (Labor, M&S, etc.) used in the All-Inclusive Index Less Fuel match those of the All-Inclusive Index used to calculate the Rail Cost Adjustment Factor.
4Q/2022 = 100.0
| Year | Quarter | All Inclusive Less Fuel | Forecast Error | Error Adjusted |
| 2014 | Q1 | 81.1 | -0.2 | 80.9 |
| Q2 | 81.9 | -0.1 | 81.8 | |
| Q3 | 82.5 | 0.0 | 82.5 | |
| Q4 | 81.9 | -0.3 | 81.6 | |
| 2015 | Q1 | 83.3 | -0.1 | 83.2 |
| Q2 | 82.9 | 0.0 | 82.9 | |
| Q3 | 82.9 | -0.2 | 82.7 | |
| Q4 | 83.2 | 0.1 | 83.3 | |
| 2016 | Q1 | 84.3 | 0.2 | 84.5 |
| Q2 | 84.2 | -0.1 | 84.1 | |
| Q3 | 84.1 | 0.0 | 84.1 | |
| Q4 | 83.1 | 0.1 | 83.2 | |
| 2017 | Q1 | 85.6 | 0.0 | 85.6 |
| Q2 | 85.6 | 0.1 | 85.7 | |
| Q3 | 85.8 | 0.3 | 86.1 | |
| Q4 | 84.8 | 0.3 | 85.1 | |
| 2018 | Q1 | 86.3 | 0.1 | 86.4 |
| Q2 | 86.3 | 0.3 | 86.6 | |
| Q3 | 87.9 | -0.5 | 87.4 | |
| Q4 | 89.1 | 0.2 | 89.3 | |
| 2019 | Q1 | 89.3 | 0.2 | 89.5 |
| Q2 | 88.8 | -0.2 | 88.6 | |
| Q3 | 89.8 | -0.3 | 89.5 | |
| Q4 | 90.3 | 0.4 | 90.7 | |
| 2020 | Q1 | 89.2 | -0.2 | 89.0 |
| Q2 | 89.5 | 0.0 | 89.5 | |
| Q3 | 88.5 | 0.2 | 88.7 | |
| Q4 | 88.5 | -0.5 | 88.0 | |
| 2021 | Q1 | 90.3 | 0.7 | 91.0 |
| Q2 | 91.5 | 0.2 | 91.7 | |
| Q3 | 94.2 | 0.7 | 94.9 | |
| Q4 | 95.0 | 0.6 | 95.6 | |
| 2022 | Q1 | 97.0 | -1.0 | 96.0 |
| Q2 | 98.1 | -0.1 | 98.0 | |
| Q3 | 99.7 | 0.4 | 100.1 | |
| Q4 | 99.9 | 0.1 | 100.00 | |
| 2023 | Q1 | 106 | -1.2 | 104.8 |
| Q2 | 109.6 | -0.4 | 109.2 | |
| Q3 | 111.2 | 0.8 | 112.0 | |
| Q4 |

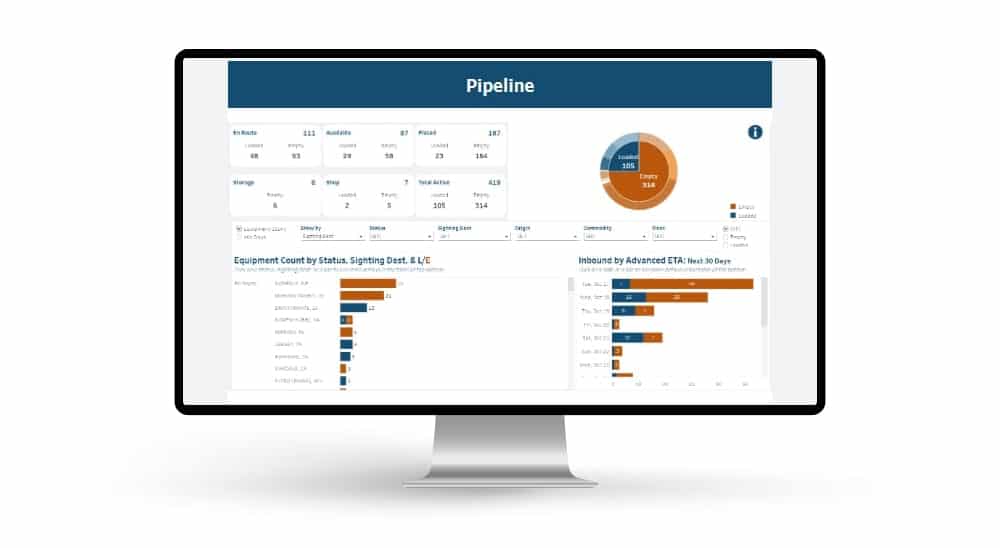
 Automated exception reporting of the railcar tracking data makes it easy to identify and troubleshoot jeopardized shipments, thereby enabling you to provide better service to your stakeholders.
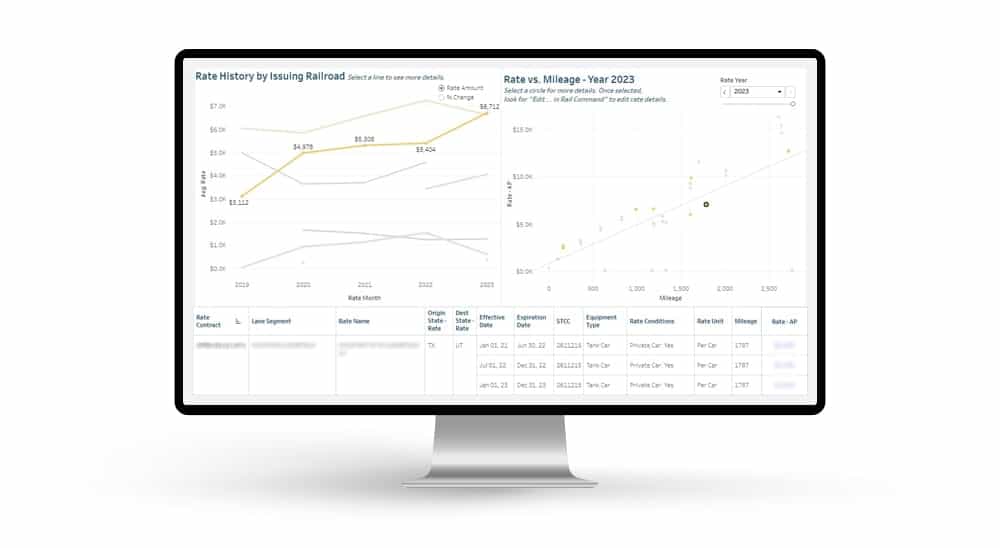
 Receive notification of pending rate expirations. Tariff changes and fuel surcharges can be automatically updated.