Have you checked out RSI’s Railroad Performance Metrics? Monitoring railroad tracking performance data of delays by railroad allows you to see and anticipate where your transit times may be affected. Here’s a recap of what the railcar tracking data has been showing in recent months:
Total volume was up in March and the YTD volume is about even with what it was last year. The chart below represents the sum of carloads originated and received from connecting railroads as reported by the AAR. Most of the increases are in sand, metals, and chemicals.

CSX and NS Railcar Tracking Reports
The daily average number of loaded and empty cars not moving for more than 48 hours is about the same.

CSX’s velocity has improved and delays have been greatly reduced. After struggling toward the end of 2017, the NS has improved in recent months. However, they are still experiencing far more train delays.
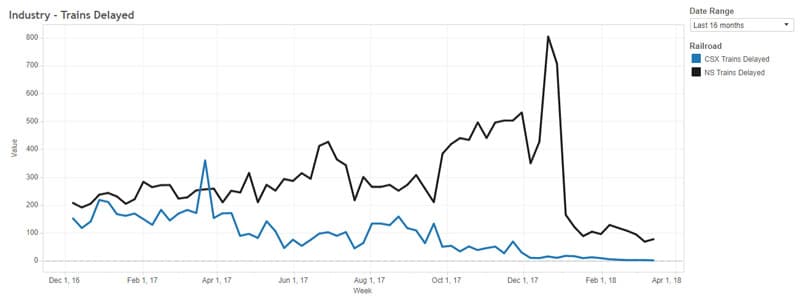
CSX has won back the volume they gave up in the late summer and fall.

UP and BNSF Railcar Tracking Reports
Volumes have remained similar, with the BN gaining an edge.

The UP has been experiencing relatively more delayed trains and cars held this year. BN’s performance has been very good considering their volumes have increased and parts of Montana experienced the heaviest snowfall in 70 years.


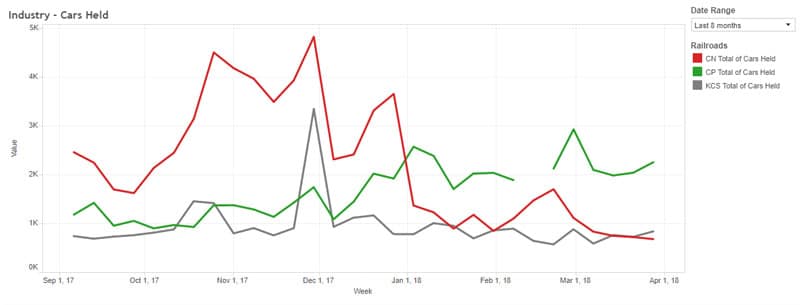
Railcar Tracking Reports for CP, CN, and KCS (U.S.)
Service issues have been more pronounced on the CP.

All of these railroad metric reports are currently available for free. Click here to filter and download your own reports.
STB Requests Service Outlook from Class I Railroads.
On March 16, 2018, the Surface Transportation Board (STB) requested that all Class I railroads provide their service outlook plans in the near term and for the remainder of 2018 due to increased concerns over deteriorating service. A brief summary of each railroad’s response is below, along with links to the letters from each carrier.
BNSF response:
- Noted that their total volume represents a historic high level for this time of year while year-over-year Q1 dwell is 7% lower vs.2017.
- Locomotives: Over the past five years, BNSF has purchased over 1,300 locomotives. BNSF has ~ 7,300 locomotives in service, with 701 additional units in storage that can be mobilized if necessary.
- Staff: expect to hire 2000 employees company-wide in 2018.
UP response:
- Locomotives: 5,700 in service with 300 in storage. Returning to service at a rate of 25 per week. Acquiring 56 in 2018.
- Staff: hiring 2,100 TE&Y employees in 2018 with 200/mo. graduating training between March and July.
CSX response:
- Locomotives: 2,900 in service with 600 in storage.
- Staff: 50 new trainmasters this spring. A total of 900 employee are on furlough.
- Expect growth to be generally flat with last year.
NS response:
- Acknowledge service issues and state a strong commitment to improve. Year-over-year velocity: Q1 2018 speed is down 16% vs. Q1 2017. Year-over-year: Q1 2018 dwell is 21% higher vs. Q1 2017
- Locomotives: have brought 100 locomotives out of storage and are leasing an additional 90. Increasing the power of some existing engines.
- Staff: In 2017 hired 1,100 conductor trainees and will hire approximately 1,400 more in 2018. Temporarily transferring crew to trouble spots.
- Improve capacity by resuming through freight operations on their Central Georgia route. Operating plan improvements such as clean sheeting in certain locations.
CN’s response:
- Locomotives: 130 leased in Q1 2018. A contract to purchase 200, the first of which will start arriving this summer.
- Staff: 400 conductors added in Q1 2018, expect to hire 2,000 employees company-wide in 2018.
CP Response:
- Locomotives: 1068 locomotives in service (a 9% increase over 2017). An additional 100 will be added by September.
- Staff: Adding 1,180 US train and engine employees, net of attrition, by Q4 2018.
Need More Information?
RSI maintains a series of railroad statistics and information that can help you be more informed. These performance charts are an example of the type of reporting that is included in our railcar management software. Notice that these charts can be filtered on the fly and downloaded in various formats. Based on your business, RSI can monitor specific events and trends and provide you with up-to-date railcar tracking information. If interested in learning more about RSI’s proactive monitoring and railcar tracking services, please contact us.