As with any industry, data and the knowledge that comes from data is important. Whether the insights you can find are helpful to you directly, as someone involved in rail shipping, or indirectly, as someone looking for information on the transportation industry, that knowledge can come in handy.
But with so much information out there, how do you know where to start and which insights can be the most helpful? Let’s take a look at seven of the most important rail shipping insights to pay attention to.
Rates and Fuel Surcharge
Fuel Costs, tariff rates, and fuel surcharge data can provide important insights into a key piece of rail shipping industry: costs.
Charges like Fuel Surcharge, Public Tariff Rates, and Private Contract Rates are levied by the railroads to compensate the railroads for the costs they incur while moving North American rail traffic. By monitoring changing fuel cost, public tariffs, private rate contracts, and imposed fuel surcharges rates, you gain valuable insight into your costs for shipping by rail.
Fuel History and Costs
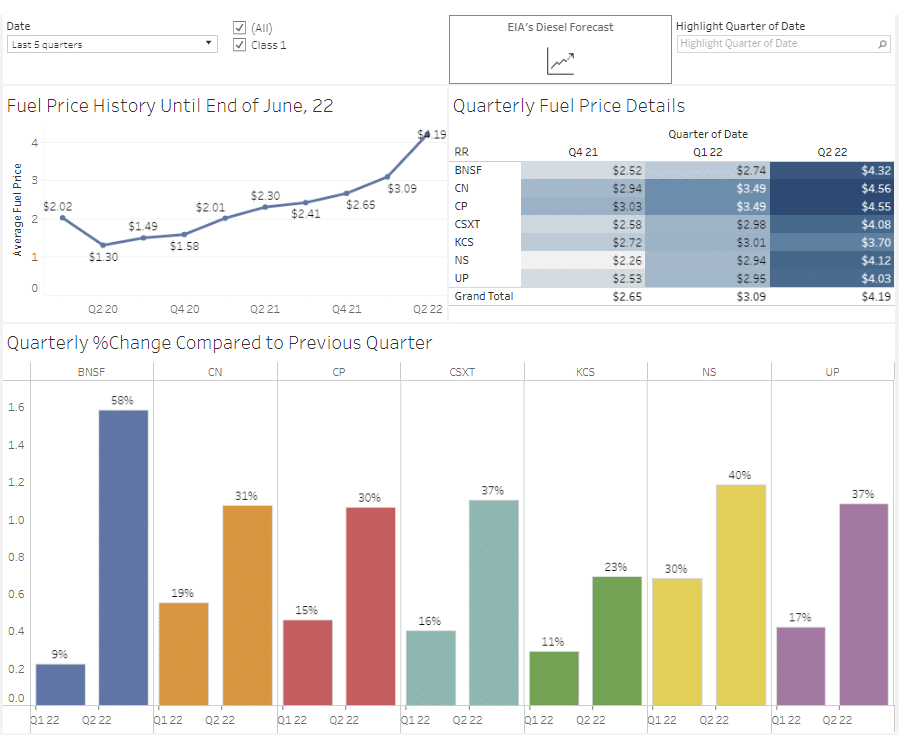
Our Fuel History dashboard displays average quarterly fuel costs for each Class I railroad. This information is disclosed by the Class I railroads in their quarterly financial releases. Included in this data is a timeline of the average fuel price, details of the fuel price from each railroad by quarter, and a comparison of the quarterly change compared to the previous quarter.
By looking at Fuel History, you can see trends in fuel prices and be prepared for potential increases in rail rates and fuel surcharges. Rising costs in fuel normally translate to rising shipping costs, in rail and other modes of transportation. So, if you see fuel costs rising, that normally means rising costs elsewhere. In this view, you are also able to compare the railroad’s reported fuel costs to the U.S. Energy Information Administration’s (EIA) fuel cost history and forecast.
Fuel Surcharge Trends
Fuel Surcharge is a tool that was designed for railroads to recover the cost of fuel that is consumed when moving railcars. To learn more about Fuel Surcharge, check out our What is Fuel Surcharge and Why is it Important blog.
Following Fuel Surcharge trends are a valuable way gain insight into the direction of fuel costs that are reflected onto the shipper. As fuel costs go up, the railroads tend to charge more to cover rising costs, which in turn pushes shipping costs higher.
Rail carrier fuel surcharge rates are indexed to the 2 months prior price of West Texas Intermediate Crude (WTI) or the On-Highway Diesel Fuel Price (U.S. Monthly Average) (HDF). The rates below are in U.S. dollars.

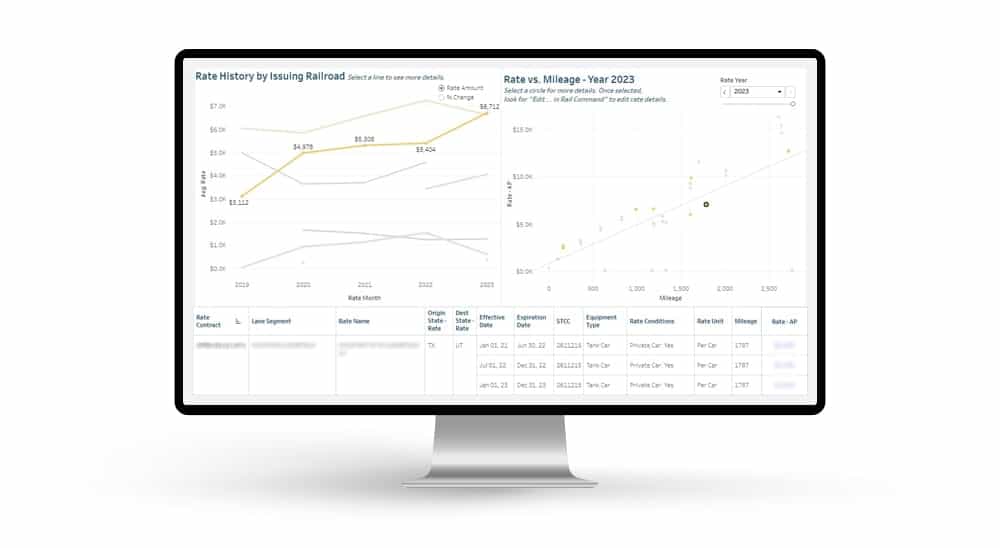
Tariff Change History
One aspect of rail that is like truck is the freight rate process. In rail, your volume may impact the overall rate you are given by the railroads. If you are not able to negotiate private freight rates, you will have to ship on a railroad’s public rate, also known as tariff rates.
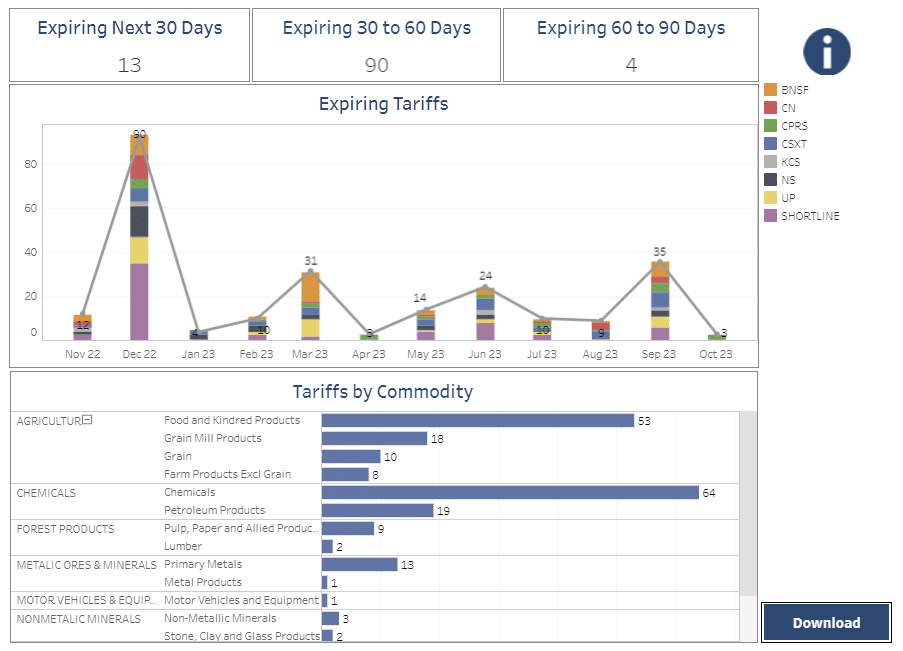
We monitor numerous public tariffs and tracks changes. This is represented here in our Tariff Change Summary dashboard. Paying attention to historical Tariff changes may help you to prepare for future charges.
Not only can you see historical changes in tariff rates, you can also get an understanding of tariffs set to expire in the next 30, 30-60, and 60-90 days. This information helps you plan for upcoming changes and proactively manage your rate database.
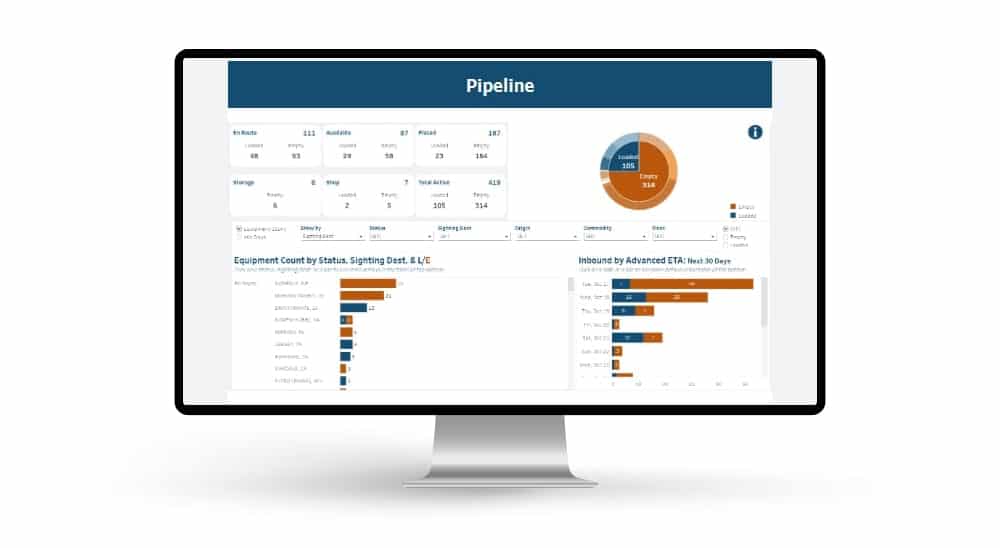
Railroad Performance
The performance of the major Class I railroads (BNSF, CN, CP, CSX, NS, KCS, and UP) are excellent indicators for the overall health of the industry. Since these railroads collect and issue a lot of data on a regular basis, it is easy to gather information. Unfortunately, there is so much data that finding insights in the massive number of numbers can be a challenge.
However, when you can untangle the data, there are plenty of helpful insights that can show trends in the rail shipping industry. Here are a few primary data points to help you understand how the rail network is performing.
Cars Held
Cars held is the average number of railcars on the Class I railroads that have not moved in 48 hours or more. This information is useful in figuring out which railroads are affected by service issues, when you might expect longer holding times, and how you might predict or plan for these events.
Monitoring railroad tracking data for the frequency of cars held by each carrier allows you to quickly find carriers experiencing service issues, and those that are making improvements. Some months or quarters may see a spike in railcars held for certain railroads, while others may see gradual increases, decreases, or relatively steady advancement.

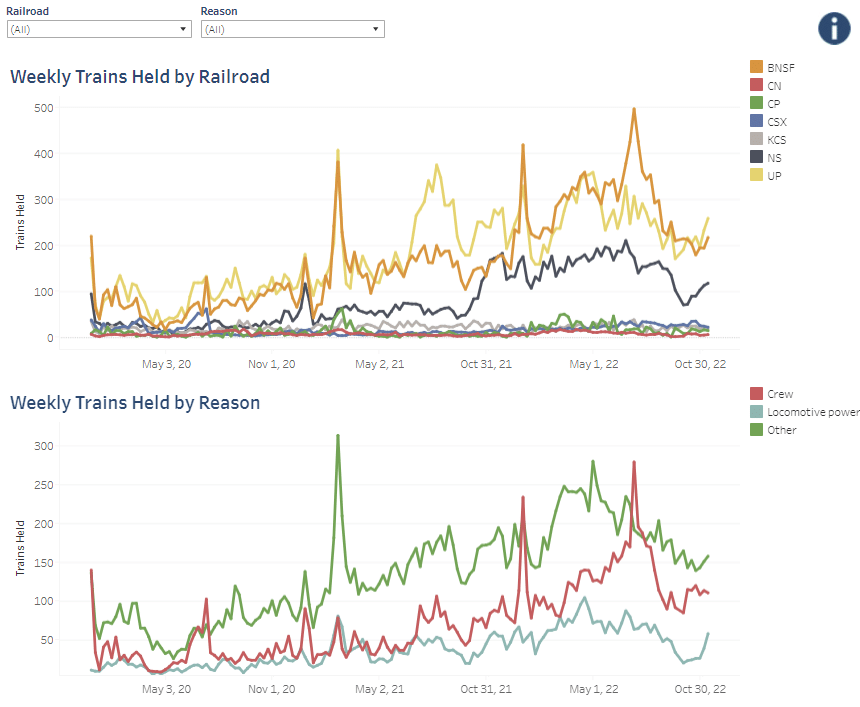
Trains Delayed
The Trains Delayed Report shows, as a weekly average, the daily number of loaded and empty trains held short of destination or scheduled interchange for longer than six consecutive hours.
This information can help you anticipate delays from railroads and potentially adjust your schedule or route accordingly. If you are experiencing more delays than expected, you can also use the Trains Delayed Report to measure your delays against the average for each rail carrier.
The weekly average of trains delayed can provide helpful insights into a railroad’s performance. This data can also show you when you might expect more delays, especially when working with specific carriers. With the Trains Delayed Report, you can check railroad performance data and predict where your transit times might be affected. You can also compare the performance of different rail carriers, which is particularly helpful when you have routing options. It is also helpful to compare rail carriers across different time periods and see when delays affect specific railroads and to what extent.
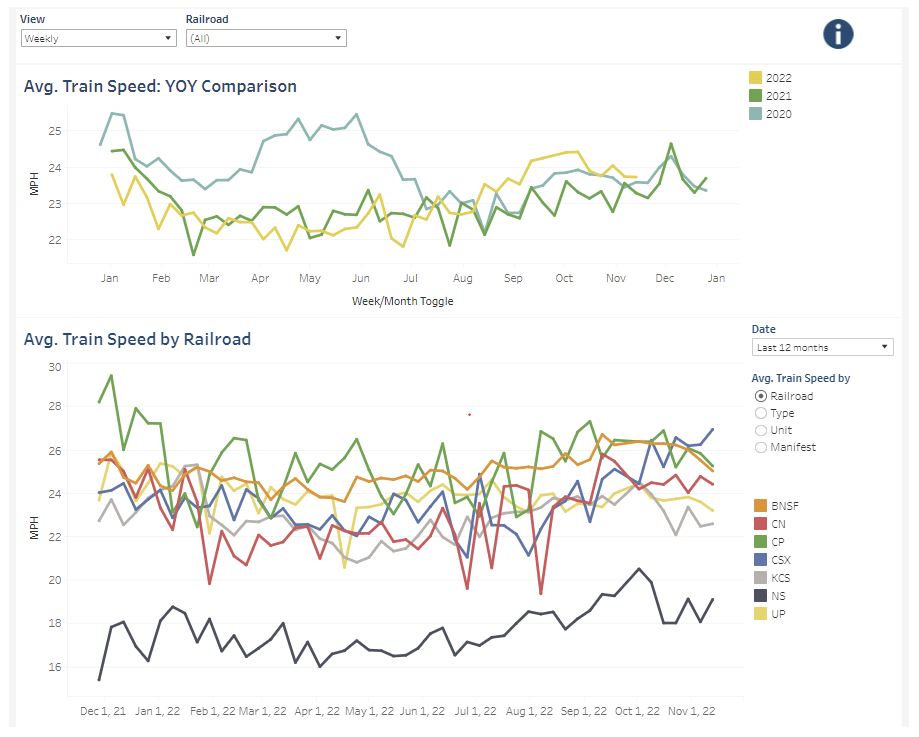
Velocity and Yard Dwell
Velocity is the speed of a train from origination to destination, including the amount of time a train dwells in a yard for a crew change, pick-up or set-off of traffic.
The Yard Dwell Time Report is a measure of the weekly average terminal dwell time, measured in hours, for the 10 largest terminals for each carrier. This information can help in figuring out the efficiency of each terminal and give you reliable information for planning rail routes.
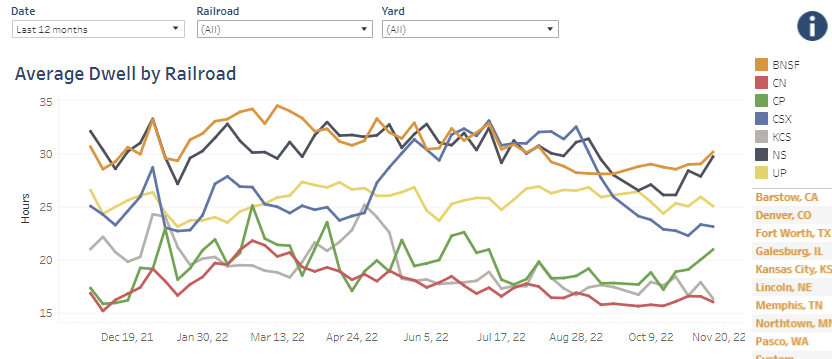
Velocity and Dwell combined are important indicators of a network’s health. When Velocity is up and Dwell is down, it shows the network is performing well because the trains are able to run quickly and move railcars efficiently.
Cars Online
The Weekly Cars Online Report shows the total amount of cars online by North American Class I Railroads, with a historical perspective. You can use this information to watch the historical trends in railcar volumes.
There are many instances where it may be useful for shippers to analyze and compare operational car data by railroad over time. For instance, this data, as well as other data points, can be a sign of how a carrier is performing, or if there are times of the year where cars are offline or online. This can help inform your shipping and logistical planning decisions.

Rail data is crucial to helping you improve the efficiency of shipping by rail. Data points such as Rail Rates /Fuel Surcharge, and Railroad Performance are two crucial measures to help you understand current and historical trends within the North American rail network.
While these data points are vital, they may not be easily accessible and consumable. However, our goal is to offer more resources to help you find bulk transloading options, storage locations, Shortline details, Serving Carrier Reciprocal details, and more, all from a central location, known as Rail Info.
To learn more about the featured graphs, as well as additional resources we offer in our Rail Info tool, check out Rail Info here.
Or if you need applications and services to help you improve your rail transportation, check out our Rail Solutions here.