Rail waybills are an important aspect of rail shipping and are typically issued on collection or receipt of the cargo by the rail carrier. This waybill outlines instructions and details related to the shipment, such as the consignor names, destination, route, and more. Each year, the railroads supply a sample of their waybill information to the Surface Transportation Board (STB), the government entity that regulates and decides disputes involving railroad rates, railroad mergers or line sales, and certain other transportation matters. This is published as the Public Use Waybill Sample.
More Waybill Sample Data Than Ever Before
This database provides traffic flow information throughout North America and gives cars, tons, and other relevant shipment information. The most currently available data is from 2021 and was released in January of 2023 with more data than ever before.
Historically, the railroads have been reporting at a 2.5% sampling rate (1 out of 40 freight bills) for manifest, or single-car shipments. The recent change in effect for the 2021 data increased the sampling rate to 20% (1 out of 5 freight bills). This is a significant increase, and it means that there is much more data for analysis in the most recently available data.
The Real Value of the Waybill Sample Data
To best understand the value of the data, it’s important to recognize what information is genuine, and which may be “masked”, or hidden, to protect confidentiality. Actual information includes the commodity at a Standard Transportation Commodity Code (a five-digit numeric code representing 38 commodity groupings) level, the miles shipped, the equipment type and owner, as well as the shipment size and the lading weight.
To protect shipper and receiver confidentiality, Station Names are not provided; rather they are grouped into Business Economic Areas (BEAs), which are relevant regional markets surrounding metropolitan or micropolitan statistical areas. In addition, Railroad names are not provided, but the number of railroads in the given movement is specified. One of the most critical pieces of information that may not be actual is Revenue, which may be hidden to protect the confidentiality of privately negotiated contract rates.
According to the 2019 Surface Transportation Board Carload Waybill Sample Reference Guide published on December 23, 2020, by Railinc:
“Railroads are permitted to “mask” contract revenue with a calculated figure. Since these figures may not represent actual revenue, use of this revenue data in any type of comparison may lead to wrong or misleading results.”
Using the Waybill Sample Data
Despite the confidentiality protections mentioned above, the Waybill Sample can still be a valuable resource. The masked data is only part of the data, and insights that are practical and valuable can be pulled from the Waybill Sample.
Three of the foremost of these insights are:
1 – Market Intelligence
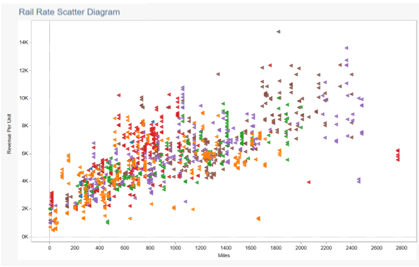
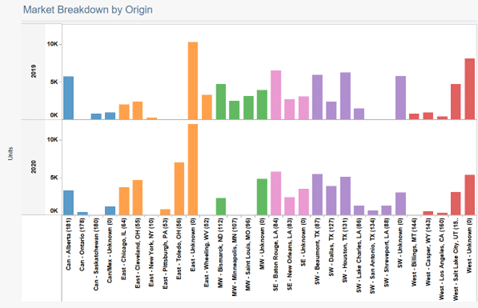
An entire market or specific lane can be analyzed.
From the BEAs and miles shown, it is often possible to figure out the actual movement for that waybill. Some of the insight that can be obtained includes how prevalent contracts are for your commodity, how widespread Rule 11 rates are, and where the largest traffic flows exist.
Contracts are agreements between buyers and sellers that establish prices, quantities, and delivery dates for a specific commodity. By analyzing BEAs and distances, your business can gain insights into how widespread contract usage is within a given region. This knowledge can inform decisions related to pricing, marketing, and supply chain optimization.
Another important insight that can be obtained by analyzing BEAs and distances is the prevalence of Rule 11 rates. Rule 11 is an accounting rule allowing carriers to separately set and publish their own shipping rates and then separately bill the customer. By understanding the prevalence of Rule 11 rates, shippers can better understand their costs by carrier, utilize various routing alternatives, and negotiate separately with each rail carrier.
In addition to contract usage and Rule 11 rates, analyzing BEAs and distances can also reveal where the largest traffic flows exist. This information can help your business identify key transportation hubs and optimize supply chain processes to take advantage of these flows. For example, if a large volume of goods is moving between two specific BEAs, businesses may consider locating warehouses or distribution centers in those areas to streamline their operations and reduce transportation costs.

2 – Competitor Analysis
Comparisons can be made to others.
Using the data, you may determine specifics of how others ship your commodity. For example, are they using the same type of equipment, do they ship in private rather than rail equipment, or are they loading their cars heavier which may result in rate advantages.
Analyzing data related to how others ship your commodity can provide valuable insights that can help improve your own shipping practices and profitability. For instance, by studying the types of equipment used by other shippers, you can determine if they are using the same equipment as you or if there are alternative options that may be more efficient or cost-effective. This knowledge can inform decisions related to purchasing or leasing equipment, as well as optimizing loading and unloading processes.
Another important aspect to consider is whether other shippers are using private equipment or rail equipment to transport your commodity. Private equipment refers to railcars owned or leased by the shipper. If other shippers are using private equipment, it may indicate that there are cost advantages to this method, which could be worth exploring for your own shipping needs. Alternatively, if rail carrier owned equipment is being used, it may be necessary to consider the associated costs.
Furthermore, analyzing the weight of the cargo being shipped by other shippers can reveal potential advantages. Maximizing loading and shipping heavier loads may contribute to annual rail freight savings. This knowledge can inform decisions related to how much to load onto each railcar.
Overall, analyzing data related to how others ship your commodity can provide valuable insights that can inform decisions related to equipment, transportation methods, and pricing. By identifying best practices and areas for improvement, you can optimize your shipping processes and improve profitability.
3 – New Opportunities
Market opportunities can be identified.
By seeing historic traffic flows, you may find a market area where you have little or no presence and want to explore those areas for market share growth.
Studying historic traffic flows can provide valuable insights into consumer behavior and preferences. By analyzing traffic patterns, businesses can identify areas where they have little or no presence and target those regions for potential market share growth. This could involve expanding your physical footprint by opening new locations or increasing your online presence through targeted marketing campaigns. Additionally, examining traffic flows can reveal trends in consumer demographics, such as age, income, and education level, which can inform marketing strategies and help businesses tailor their offerings to better meet the needs and preferences of potential customers. Using the Waybill Sample historic traffic flows is an important tool you can use to break into new market areas, improve your market share, and reach new customers.
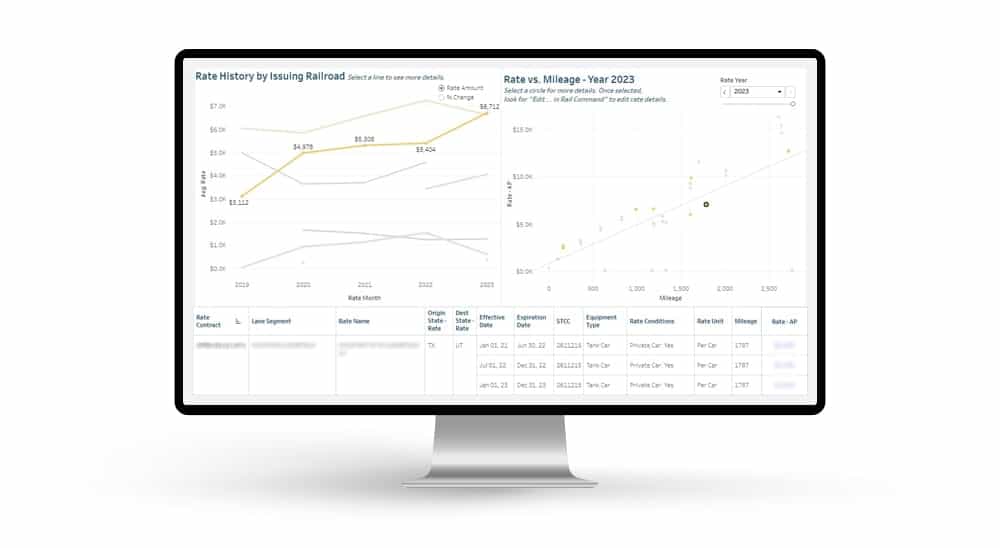
The data provided in the Public Use Waybill Sample can be analyzed in many ways. Here at RSI we incorporate this information into four user-friendly reports for further analysis in our rail rate application, Rail Impact®.
Don’t miss out on the opportunity to optimize your rail transportation strategies with Rail Impact®. Sign up for one of our free online webinars today and discover how our tool can help you leverage the data from the Waybill Sample to make informed decisions and improve your bottom line.