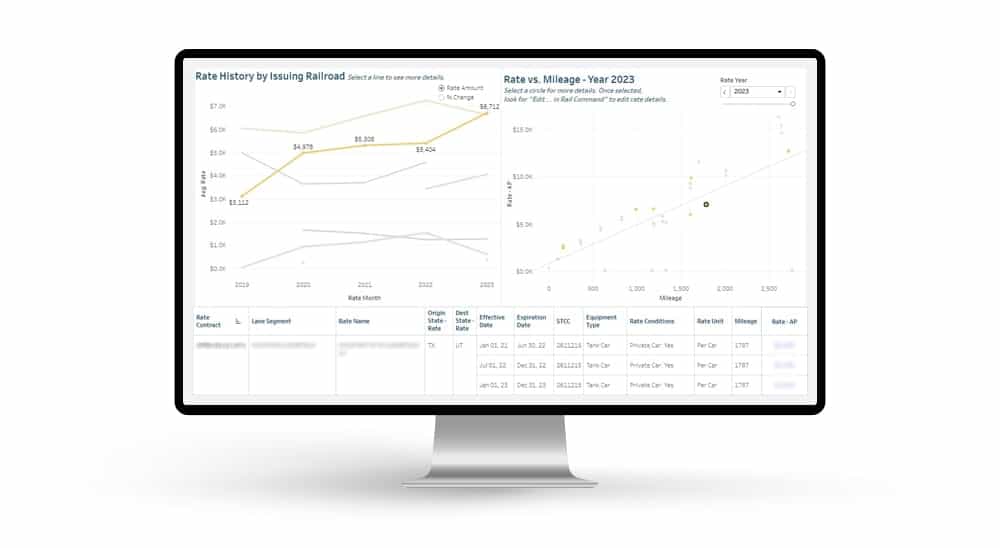
Each quarter the Surface Transportation Board makes available data from the seven Class 1 railroads, including commodity specific traffic volume, tonnage and revenue. Units and tons are also broken down by class of traffic: local, forward, received, and bridge. These data represent the most current detailed railroad traffic and revenue data publicly available. Fluctuations in revenue are not limited solely to rate actions, but may be the result of changes in traffic patterns and fuel surcharges. Analysis of the data can provide insight into competing railroads’ market share, as well as differences in overall rate levels.

Commodity: LPG
Source: Rail Impact