Good data helps you make informed decisions, measure your goals, find solutions to problems, and be strategic in your methods. Without data you’re relying on “gut feelings”, which can be affected by different experiences, assumptions, and abstract observations.
Whether you’re planning out your rail supply chain and organization, working on a consultation project for a railroad, or studying the rail industry as a piece of the overall economy, data allows you to make informed decisions. Without data to help you make decisions based on indisputable evidence, you’re in danger of taking actions based on incorrect conclusions.

For instance, suppose you’re a rail logistics professional who needs to develop a budget for the year. Part of your budget preparation includes planning for demurrage. Without data, you’re relying on your own experience, which can be biased. However, with data, you can see the trends that demurrage charges take, and more accurately predict what your charges might look like next year.
In this post, we’ll provide five examples of places you can find rail data and, just as importantly, insights
Why are Data Insights Important?
Collecting rail data can sometimes be a difficult task. The data about the overall industry is sometimes broken up amongst the different railroads and government organizations. Sharing isn’t always a priority for these organizations, and when sharing does happen, it rarely is in a format that is easy to pull insights from. Much of the data is downloadable via long lists of the raw numbers.
Data needs to be analyzed so that you can pull actionable insights from them. Without insights that can be easily analyzed and applied, the raw data is just numbers. Figuring out how to decipher the data is just as important as finding good, trustworthy sources for data.

Resources for Rail Industry Data
Although there are many places to find rail industry data and the accompanying insights, some places are more effective than others! Below we’ll look at the five places you can find trustworthy data from and see which of these places help you find insights from the numbers.
Surface Transportation Board
The Surface Transportation Board (STB) is a federal agency that is charged with the economic regulation of freight rail, as well as other modes of surface transportation. The STB collects a significant amount of data and posts it to their website in their Reports and Data section. The topics that the STB’s data covers are extensive, including economic data, rail service data, demurrage and accessorial charges, and more. Since it is a federal agency, the STB gathers this information directly from the railroads and Railinc, meaning that you can be guaranteed the data is accurate.
Unfortunately, the STB’s data is released in difficult to understand lists of raw data. Pulling insights from the data requires knowledge and experience to find the raw data you need, then manipulate it to pull actionable information. For example, every week the STB releases information on railroad performance by systems and commodities, but this data is released in a list format of numbers each week, so to compare how a commodity has been doing for the last few years, you would have to take each week’s data, isolate it, and compare it outside of the list.

Rail Carrier’s Websites
Each of the Class I carriers (BNSF, CN, CP, CSX, KCS, NS, and the UP) release data about themselves on their website, primarily financial information. Since these carriers provide the vast bulk of rail transportation in North America, the data they make available can be used to get a great look at the overall health of the rail shipping industry, which itself is a big piece of the overall economy.
However, the rail carriers only release information about themselves on their websites, meaning that if you want to compare you must go to each of their sites and collect the data before you can put it together. Furthermore, since they primarily only release financial information, that makes it effective only for insights regarding business data.
The Association of American Railroads
The Association of American Railroads (AAR) is an industry trade group that represents mostly the Class I major freight railroads of North America, which are the seven we listed above. Similarly to the STB, the AAR collects data from the major railroads and makes it available in their Data Center. The AAR Data Center gathers information on finances, operations, performance, traffic, and more.
Much like the STB, this information is mostly available as static documents and lists, requiring you to do the work to pull insights. However, unlike the STB, the AAR Data Center does have a few visual charts and dashboards. Some of them can be manipulated while others are fixed. Unfortunately, the AAR’s Data Center only releases some data for free, and the rest is locked behind a paywall.
RailPrime
RailPrime is an information source from Progressive Railroading. This article-based subscription focuses on key trends, special reports, industry news, and other material concerning the rail industry. While the AAR Data Center and the STB’s information are raw lists of data, RailPrime’s data and insights are released through write-ups and are mostly concerned with trend-tracking information and news releases.
Although most of RailPrime is not concerned with raw data, rather news and trends, they do have a section called Prime Numbers, which is a bi-weekly article that goes through data trends in the freight transportation industry in a written format. If you like your data conclusions written out for you, RailPrime is your go to; however, for those who want to study the data to reach their own conclusions and insights, this can make it difficult to do so.
Rail Info
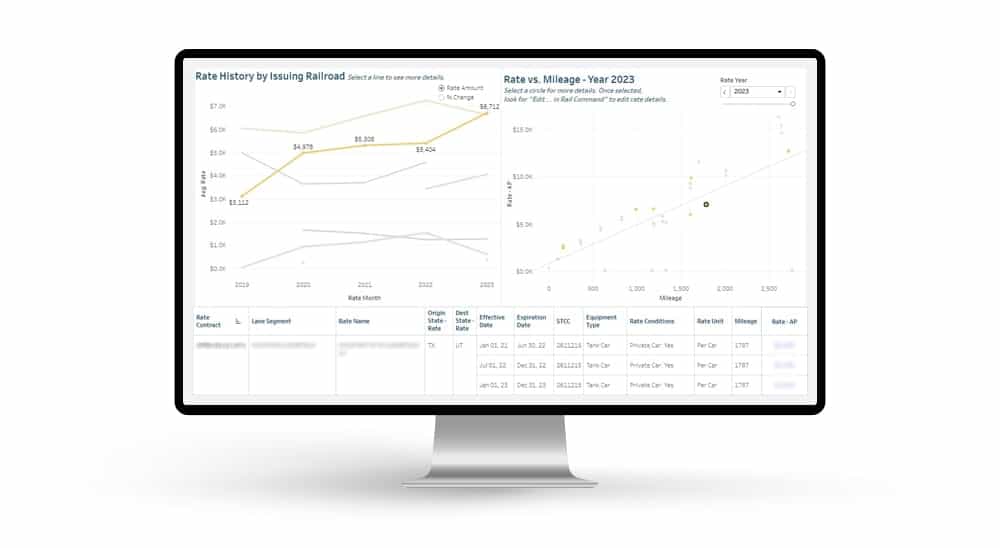
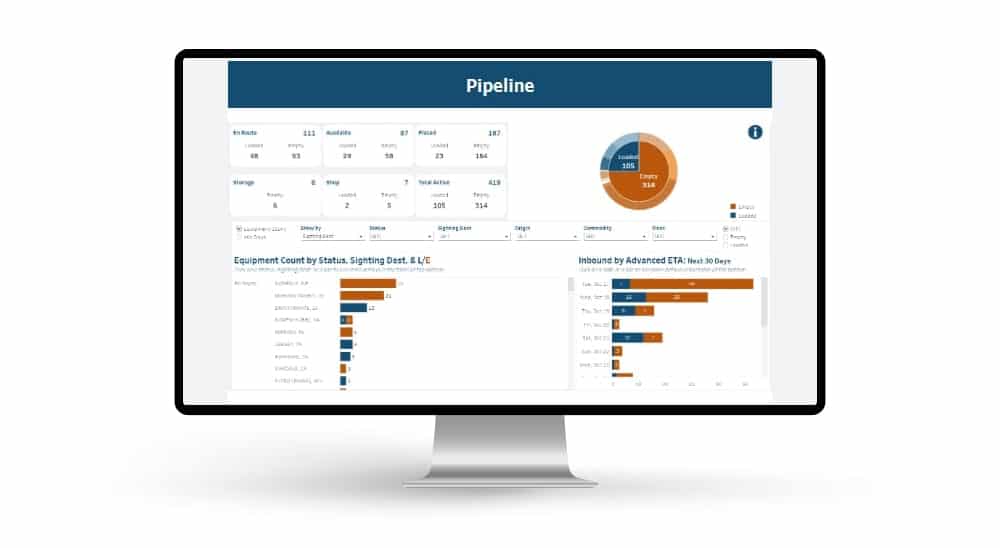
Rail Info is our data analysis tool that we created to import data from some of the above sources and easily provide insights. We designed comprehensive dashboards to visualize the data; these custom dashboards make your analytics journey more streamlined!
We break down the data into topics such as Fuel Surcharge rates, Transloading Terminal directories, Delay reports, and more. This allows you to have the same data, as well as additional data, from the STB and AAR; however, with Rail Info the insights are ready to go for you. Our dashboards are built by railroad professionals who have experience in knowing what data to look for from the raw data, so we design the dashboards around both the data and the insights you’re looking for.
Data is an important aspect of studying the rail shipping industry and is important to make unbiased decisions. However, data is only as important as the insights that you can pull from the numbers. As a result, it is important to find places where you can collect data and easily pull insights from the data. Although there are a few places where rail industry information can be collected, most of them are focused on either the raw numbers or the resulting trends, not both.
Rail Info is our solution to this problem and offers both a good look at the data and the ability to easily find insights in our custom dashboards. Click here to check out Rail Info and get the first month free!