Industry Volume Data
As the month of August has officially come to a close, we are able to analyze some monthly metrics as reported by the Railroads. All Class I, North American Railroads are required to submit monthly metrics to the STB. A common metric that is involved in this data reporting is Trains Delayed. This type of data represents a weekly total number of loaded and empty trains held short of a destination or scheduled interchange for longer than six consecutive hours. The image below depicts the last eight months of industry data for Trains Delayed. It may be surprising to see that the number is slightly rising for most Railroads compared to previous months. This type of increase is uncommon during summer months where weather delays are infrequent. This may be caused by service cutbacks. Click here to see more Railroad Performance stats.
Enhancements to RSInet Tracking & Management Software
RSInet has launched version 16.6 within the past two weeks. Features involved in this update include:
- Party At Pick Up added to multiple pages to find associated shipping parties
- New filters and outputs added including Creator, Modifier Name/Date, and Origin/Destination Switch Type
Rail Carrier Revenue
As indicated in our July journal entry, carrier revenue per shipment has seen a decline over the last few quarters. Along with carrier revenue decreases, rates are also illustrating the same behavior. For a number of our customers, 2016 is going down as one of the best for shippers to renegotiate rates. We have seen rail carriers make adjustments to win business in ways that we have not seen in 20 years. If you have truck lanes that can be converted to rail, now would be a good time to evaluate those opportunities.

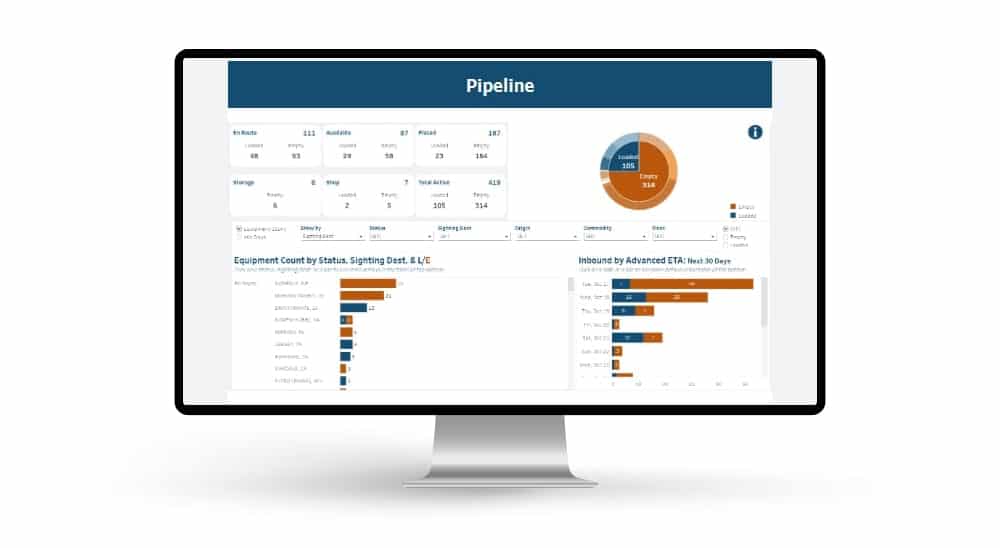 Automated exception reporting of the railcar tracking data makes it easy to identify and troubleshoot jeopardized shipments, thereby enabling you to provide better service to your stakeholders.
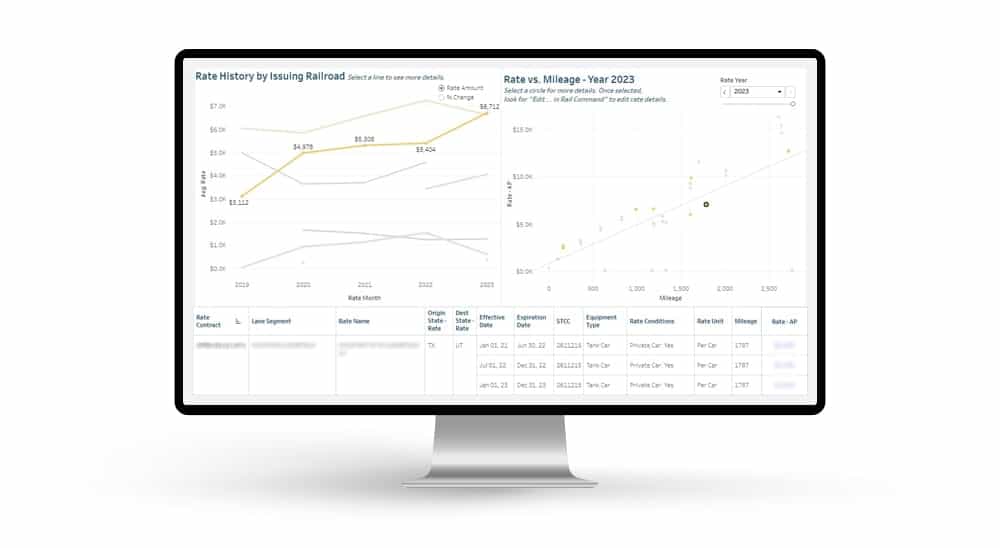 Receive notification of pending rate expirations. Tariff changes and fuel surcharges can be automatically updated.